アプリケーションメトリクス
このセクションでは、ワークロードによって公開されるメトリクスへの洞察を得る方法を見ていきます。例としては以下のようなものがあります:
- Java ヒープメトリクスやデータベース接続プールのステータスなどのシステムメトリクス
- ビジネス KPI に関連するアプリケーションメトリクス
CloudWatch エージェントを使用してアプリケーションメトリクスを取り込み、Grafana を使用してメトリクスを可視化する方法を見てみましょう。
このワークショップの各コンポーネントは、特定のプログラミング言語やフレームワークに関連するライブラリを使用して Prometheus メトリクスを提供するように計装されています。以下のように orders サービスからこれらのメトリクスの例を見ることができます:
[...]
# HELP jdbc_connections_idle Number of established but idle connections.
# TYPE jdbc_connections_idle gauge
jdbc_connections_idle{name="reader",} 10.0jdbc_connections_idle{name="writer",} 10.0[...]
# HELP watch_orders_total The number of orders placed
# TYPE watch_orders_total counter
watch_orders_total{productId="510a0d7e-8e83-4193-b483-e27e09ddc34d",} 2.0watch_orders_total{productId="808a2de1-1aaa-4c25-a9b9-6612e8f29a38",} 1.0watch_orders_total{productId="*",} 3.0watch_orders_total{productId="6d62d909-f957-430e-8689-b5129c0bb75e",} 1.0このコマンドの出力は冗長なので、上記の例では以下を示すために整理されています:
- システムメトリクス - アイドル状態の JDBC 接続の数
- アプリケーションメトリクス - 小売店を通じて注文された数
checkout サービスなど、他のコンポーネントに対して同様のリクエストを実行できます:
[...]
# HELP nodejs_heap_size_total_bytes Process heap size from Node.js in bytes.
# TYPE nodejs_heap_size_total_bytes gauge
nodejs_heap_size_total_bytes 48668672
[...]
このラボでは、CloudWatch エージェントを使用してすべてのコンポーネントのメトリクスを取り込み、注文された数を表示するダッシュボードを探索します。アドオンに適用した OpenTelemetry 設定からの kubernetes-pods スクレイプジョブを見てみましょう:
job_name: kubernetes-pods
honor_labels: true
kubernetes_sd_configs:
  - role: pod
relabel_configs:
  - source_labels: [__meta_kubernetes_pod_annotation_prometheus_io_scrape]
    action: keep
    regex: true
  - source_labels: [__meta_kubernetes_pod_annotation_prometheus_io_scrape_slow]
    action: drop
    regex: true
  - source_labels: [__meta_kubernetes_pod_annotation_prometheus_io_scheme]
    action: replace
    regex: (https?)
    target_label: __scheme__
  - source_labels: [__meta_kubernetes_pod_annotation_prometheus_io_path]
    action: replace
    target_label: __metrics_path__
    regex: (.+)
  - action: labelmap
    regex: __meta_kubernetes_pod_label_(.+)
  - source_labels: [__meta_kubernetes_namespace]
    action: replace
    target_label: namespace
  - source_labels: [__meta_kubernetes_pod_name]
    action: replace
    target_label: pod
  - source_labels: [__meta_kubernetes_pod_phase]
    regex: Pending|Succeeded|Failed|Completed
    action: drop
この設定は、Prometheus の Kubernetes サービスディスカバリメカニズムを使用して、特定のアノテーションを持つすべての Pod を自動的に検出します。この設定は、prometheus.io/scrape アノテーションを持つすべての Pod を対象とし、スクレイピングされたメトリクスに namespace や Pod 名などの Kubernetes メタデータで強化します。
order コンポーネントの Pod のアノテーションを確認できます:
prometheus.io/path: /actuator/prometheus
prometheus.io/port: "8080"
prometheus.io/scrape: "true"
クラスターメトリクスに関するセクションで見たように、これらの Pod メトリクスも同じ Prometheus Remote Write エクスポーターを使用して AMP に送信されます。
次に、以下のスクリプトを使用してロードジェネレーターを実行し、ストアを通じて注文を行い、アプリケーションメトリクスを生成します:
前のセクションで行ったように Grafana を開きます:

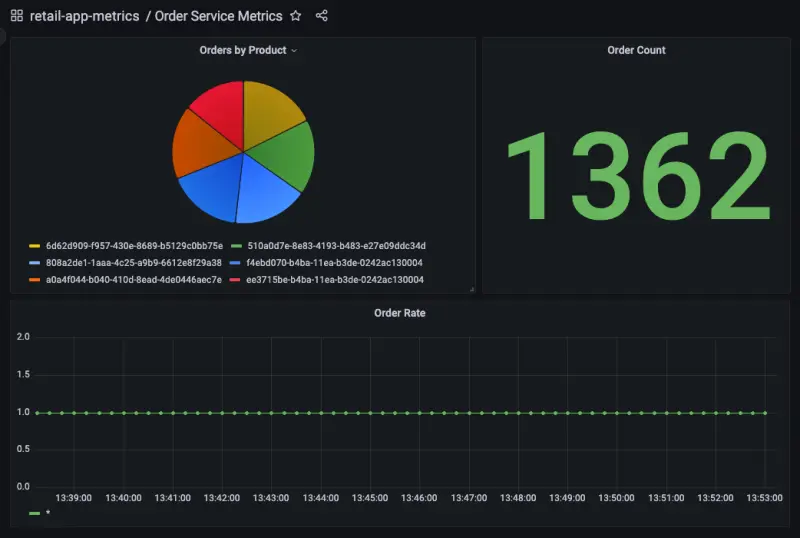
ダッシュボードページに移動し、Order Service Metrics ダッシュボードをクリックして、ダッシュボード内のパネルを確認します:
「Orders by Product」パネルのタイトルにカーソルを合わせ、「Edit」ボタンをクリックすることで、ダッシュボードが AMP をクエリするように設定されている方法を確認できます:
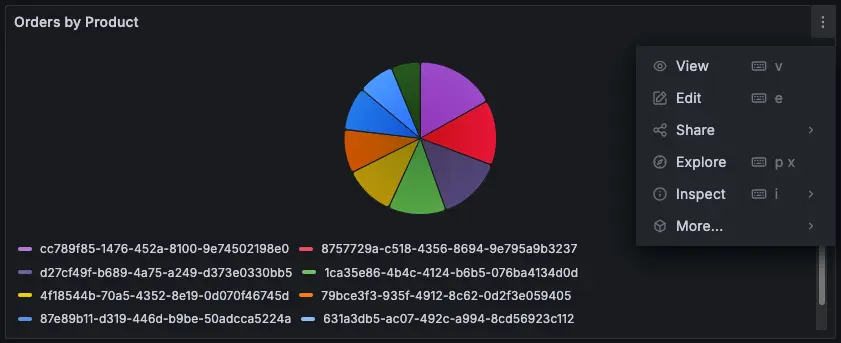
このパネルの作成に使用された PromQL クエリはページの下部に表示されます:

この場合、次のクエリを使用しています:
sum by(productId) (watch_orders_total{productId!="*"})
これは以下のことを行っています:
watch_orders_totalメトリクスをクエリするproductIdの値が*のメトリクスを無視する- これらのメトリクスを合計し、
productIdでグループ化する
同様に他のパネルを探索して、それらがどのように作成されたかを理解できます。
メトリクスの観察に満足したら、以下のコマンドを使用してロードジェネレーターを停止できます。